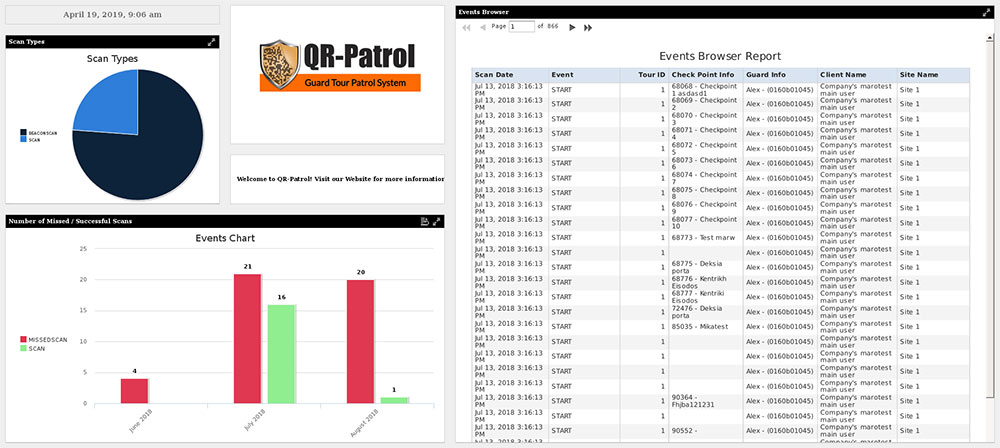
Navigate to the BI/Analytics menu and the select the Dashboard Designer tab. You will be navigated to the Dashboard screen. Dashboards display several reports in a single, integrated view. A dashboard can include other dashboards, input controls for choosing the data displayed in one or more frames, and custom frames that point to URLs for other content. By combining different types of related content, you can create appealing, data-rich dashboards that quickly convey trends.
Drag and drop your reports and arrange them as you like inside the dashboard. Use images, text, charts and hyperlinks to other sites to enrich your dashboard even more.