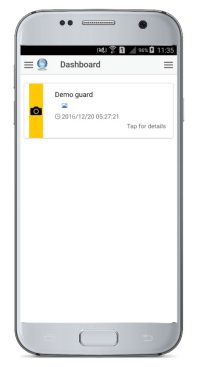
Once you login, the Dashboard will show up.
The last submitted Event by each of your Guards, is displayed on the Dashboard, along with some details about it, such as the Name of the Guard who sent it and the Date and Time that was submitted.
The icon on the left of the Event, indicates its Type.

By clicking on the Event, you are able to see more details:
- The Name and ID of the Guard
- The Type of the Event
- The Date and Time that was submitted
- The Checkpoint’s ID and Description
- The last acquired location of the Guard and the date/time of it
- In case of a SCAN Event, you are also able to see the Client and the Site that the point is assigned to.
You additionally have the option to display:
- Guard’s history actions
- His location on the map
- Details of his Patrol
- In case of a MM Event, you can also view the image, text or signature attached.

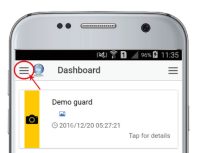
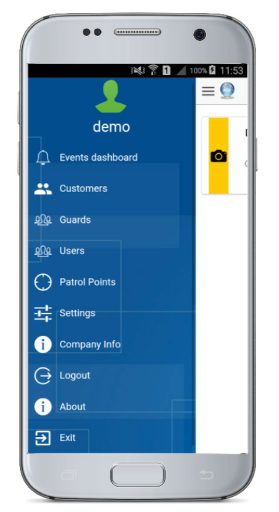
By clicking on the top-left button, you are able to choose one of the following options:
- Events dashboard
- Customers
- Guards
- Users
- Patrol Points
- Settings
- Company Info
- Logout
- About
- Exit


