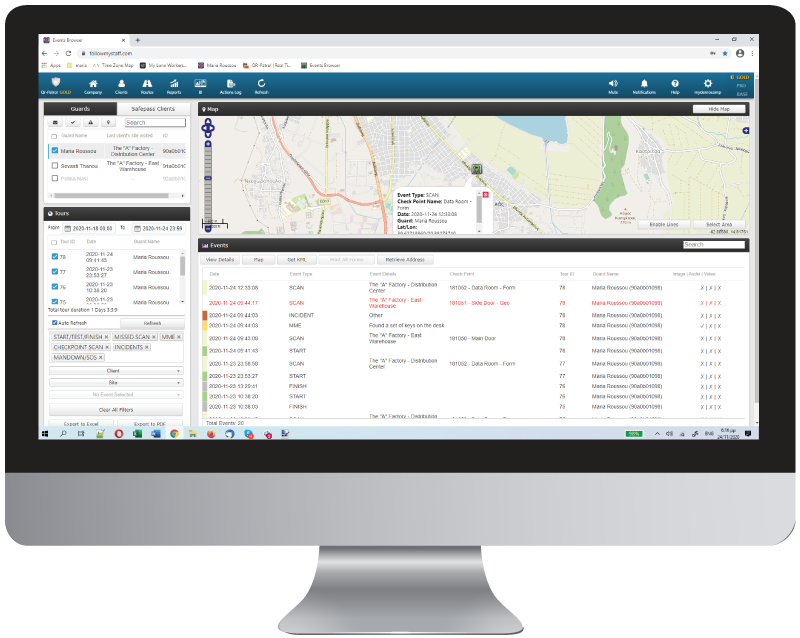
Logging into the web application, you can now access the full functionality of QR-Patrol. The central screen of the application consists of all the neccesary information and actions in order to immediately manage patrols and guard tours and gain full control over your officers’ activities.
Dashboard
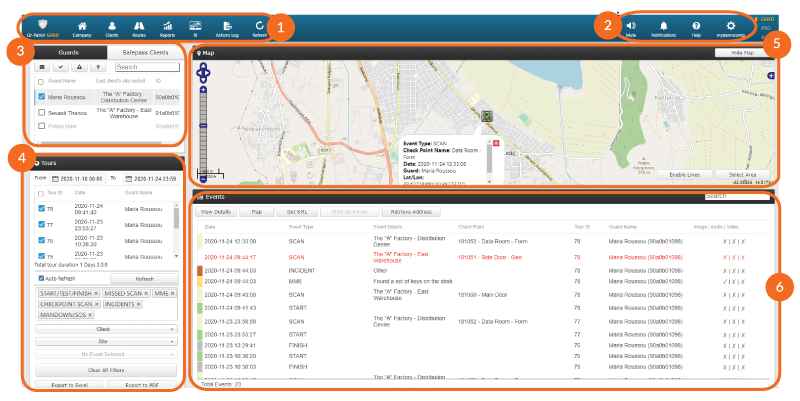
At the top you can see the main toolbar of the application, with the following options:
Company, which includes all info about the company (clients, branch offices, users, etc.)
Clients, which includes all the clients of the company.
Routes, where you can organize and schedule routes.
Reports, where you can export advanced filtered reports.
BI, where you can create custom reports based on your needs.
Actions Log, where you can view all actions made in the web app.
01
Basic Navigation Bar
Navigate through all the basic options of QR-Patrol web application such as Company, Clients, Routes and Reports.
02
Help / Settings options
Change the language of QR-Patrol application (English, Spanish, Italiano, Greek, Russian, German, Portuguese) and login settings.
03
Guards section
Select guard(s) in order to view all available patrols or make a specific action (track guard, send message, mute, etc.)
04
Tours section
View all tours for the selected guard(s) by selecting dates, client, site and export data to excel or PDF format.
05
Map
Monitor all guards’ activities on the map and select a specific circle area in order to see all guard’s activities in this area.
06
Events section
For submitted events, you can see more details such as event location, photos, voice recordings, notes or signature of the guard.