- Go to the Ad Hoc View Panel and click on the
 icon to show the Canvas Options
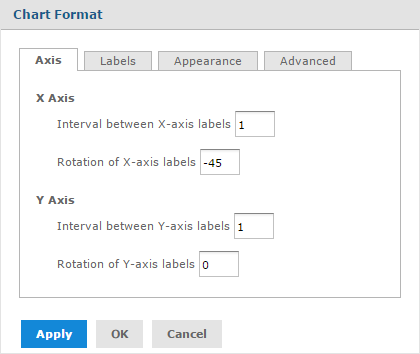
 - Select the Chart Format option from the context menu to open the corresponding window.
- Click on the Appearance tab and select the Show data points on line charts
- Click on Apply and then on The name will appear along the value axis.
- Remove the data points from the chart by opening the Appearance tab and deselect the Show data points on line charts