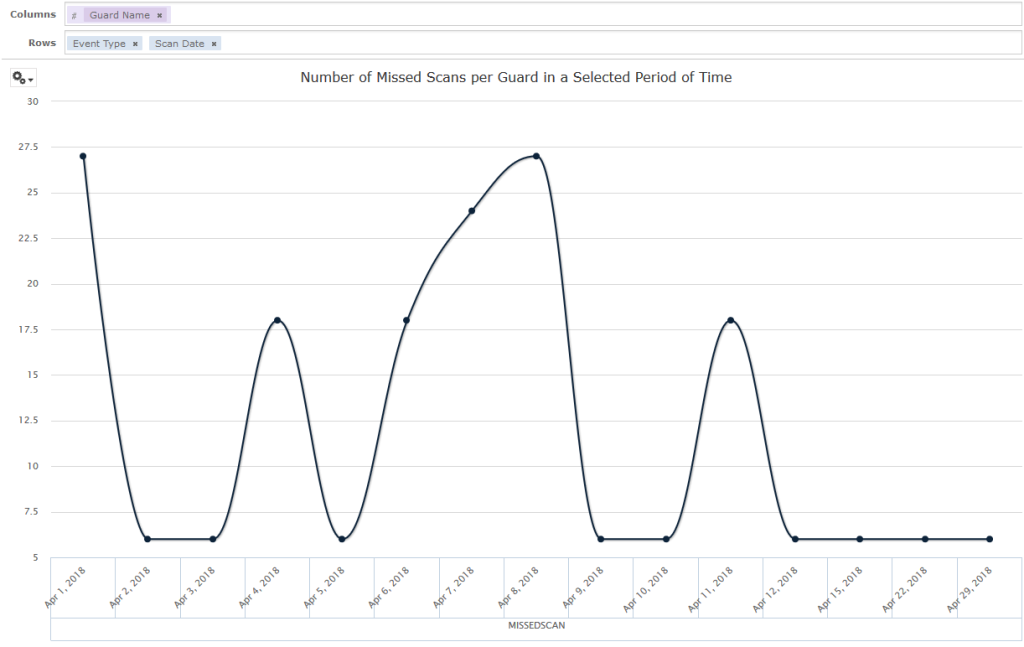
QR-Patrol PRO Report Designer offers charts, a flexible and interactive way and gives its user the ability to explore and visualize their data graphically.
- Choose different levels of aggregation for rows and columns.
- Change a field from a column to a row.
- Pivot the entire chart.
- Hide the chart values.
- Zoom in to see your chart details.

In the following sections it will be explained how to populate, edit and format these charts. Many tasks related to working with Charts are identical, if not very similar, to those for tables and crosstabs.


